1.3 Composition Diagrams
A composition diagram shows which agents have access to which action fields. The agents and the action fields
are symbolized by two-dimensional nodes, so that an access relationship can be represented by a line whose one end
lies on the boundary of an agent node while the other end lies on the boundary of an action field node. Agent nodes
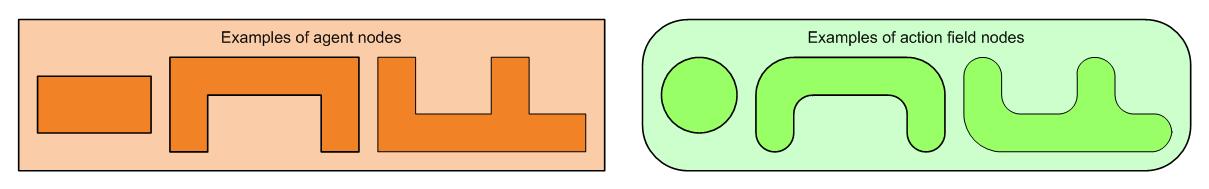
differ from the action field nodes by the form of their symbols. The boundary of an agent node consists only of
alternating horizontal and vertical straight sections. In the simplest case, agent nodes have the shape of rectangles.
In contrast to this, action field nodes in the simplest case have the shape circles. However, they may also contain horizontal and
vertical straight sections connected by half or quarter circles. With the choice of these shapes for the nodes, principles of common
symbolizations have been adopted: Rectangles have always been used as symbols for functional units, and ellipses or
ovals are used as symbols for sets in mathematics. Using the set symbol helps to associate the idea of containers
of passive objects with the concept of action fields.
In the case of software systems, the agents are software-controlled computers. However, since the principles of cooperation systems are
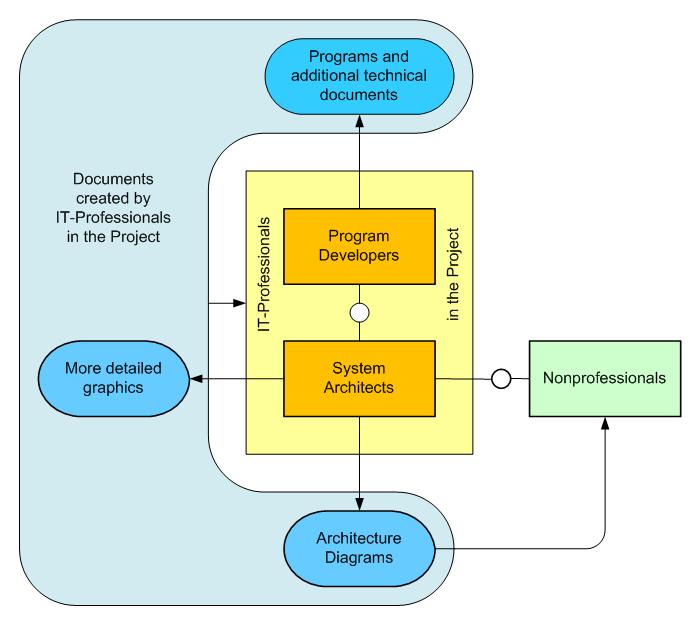
independent of the nature of the agents, an example of a composition diagram is presented in which only people act as agents:

|
The following information can be obtained from the composition diagram on the left: - The system architects create architecture diagrams and more detailed graphics. - The program developers create programs and additional technical documents. - IT professionals who are involved in the project can look at every document they and their colleagues have created. - The non-professionals can only view the architecture diagrams. - There is an unspecified channel for direct communication between the system architects and the program developers. - There is also an unspecified channel for direct communication between the non-professionals and the system architects. |
The importance of layout optimization
In the definitions of the three types of FMC diagrams, the layout does not matter; but the quality of an FMC diagram depends very much on its graphical layout. The decisions that determine the layout affect the shape, size, and location of the two-dimensional nodes, and the directions of the connecting lines between the nodes. The layout determines how easy or difficult it is for the viewers to remember the graphical structure of a diagram and to communicate about it, even if it is not actually present. Anyone who has seen many diagrams with particularly good layouts is well prepared to draw diagrams of similar quality. This applies to architects of buildings as well as to architects in the field of software.
|
In order to demonstrate the importance of layout optimization, the composition diagram from above is shown on the right with a different layout.
Regarding their technical content, the two plans do not differ, but the first plan undoubtedly has a better layout than the second one. |
|