In the second chapter, a further example of a process diagram is shown, since in the methods presented there, process diagrams play a central role.
A process diagram illustrates causal dependencies between actions. There is a causal dependency between two actions when one action can only begin after
the other action is finished. The most common case of a causal dependency is that one action creates a situation that is a prerequisite for the other action.
For example, a coffee cup must first be filled before the coffee can be drunk. In this type of causal dependency, it is irrelevant whether the two actions are
executed by the same agent or by two different agents. But there is also a second kind of causal dependency: This occurs if two different agents want
to carry out actions in which they need to access the same workpiece. In this case, the two actions are in conflict: they can only be executed one after
the other, but their order is arbitrary.
A process diagram shows the relations between actions and situations: Some situations can be prerequisites of an action, and some situations can be
consequences of an action. The actions are symbolized by rectangles, the situations by circles. In the process diagrams, the presence of a particular
situation is represented by a token being placed into the corresponding situation node. An action can only begin when all the situations it requires are
present, that is, if all situation nodes, from which an arrow leads to the action node, are marked by tokens. One can imagine that the agent who performs
the action first collects all the required tokens before he starts the action, and that after the action is completed, he places tokens into all the
situation nodes, to which an arrow points from the action node.
|
|
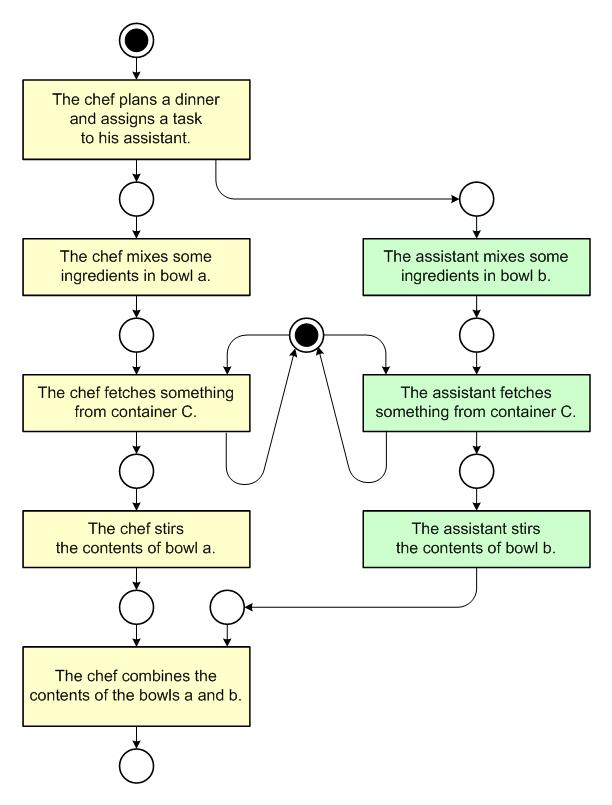
The process diagram at the left shows actions of two agents, namely a chef and his assistant. As long as each of them needs to have access to his own bowl only,
they can act independently of each other. However, as soon as they need to get access to the same container C, they can only do this one by one.
The sequence, however, is irrelevant. This conflict situation can be recognized by the symmetry of the arrows: each of the two agents needs the token located
in the situation node in the middle of the diagram. Only after one agent is finished with the fetch, the token is available to the other agent for his action.
In the second chapter, a further example of a process diagram is shown, since in the methods presented there, process diagrams play a central role. |