| Home |
1.1 Two Problems |
1.2 Concept of the Solution |
1.3 Composition- Diagrams |
1.4 Process- Diagrams |
1.5 Data- Structure- Diagrams |
1.6 Metadiagram of the FMC-Diagrams |
1.7 Layering of Interpreters |
1.8 Separation of Phases |
1.6 Metadiagram of the FMC-Diagrams
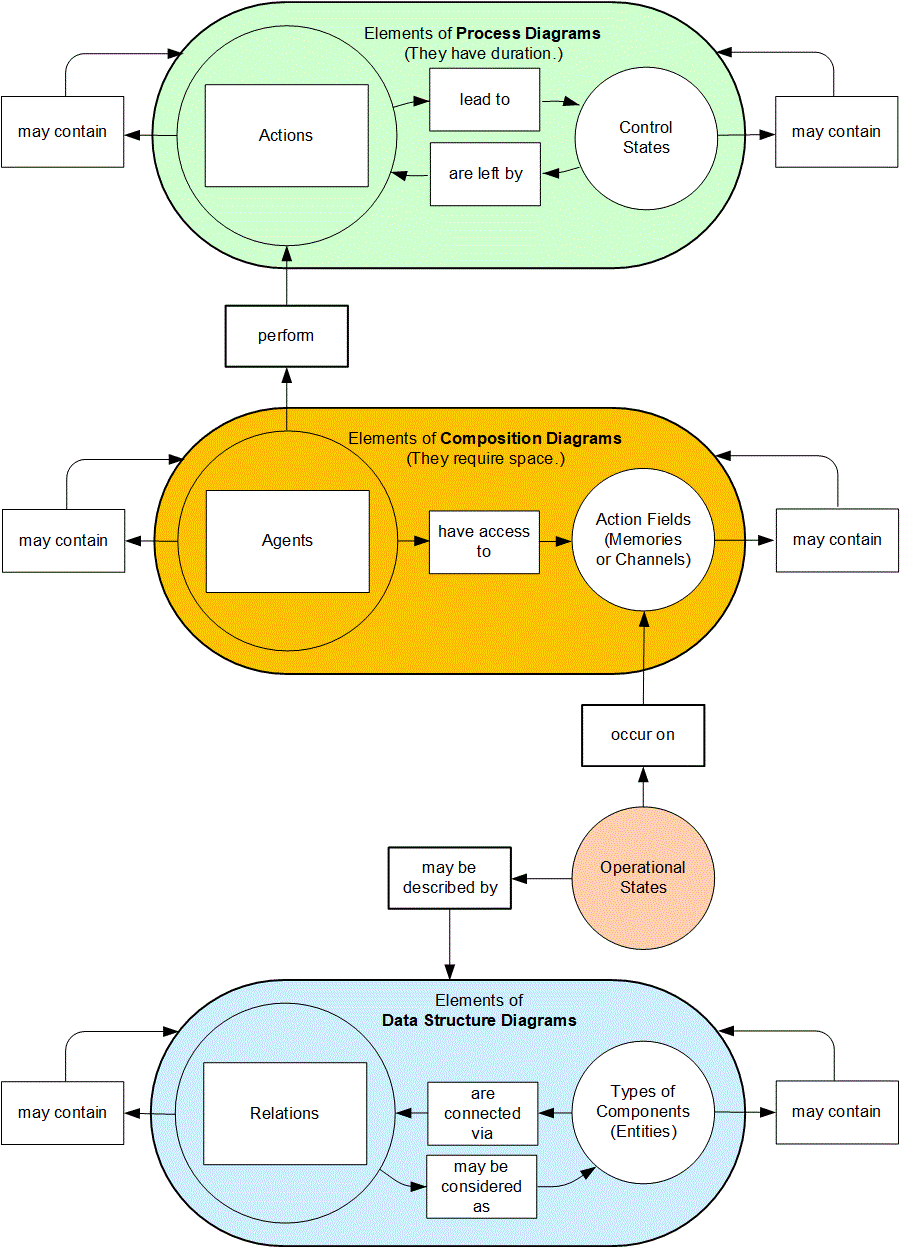
The structure of the FMC conceptual worldThe types of diagrams introduced in the three chapters 1.3, 1.4 and 1.5 are related to each other and can therefore be combined into a single so-called metadiagram. The name metadiagram indicates that this diagram says something about diagrams.
The diagram presented below describes three bipartite graphs based on the FMC terminology. The term bipartite characterizes graphs which contain only two types of nodes where connections between nodes are restricted to pairs of nodes of a different type.
The nodes of the FMC diagrams can stand for coarsened structures, which in turn can themselves be described by the respective type of diagram. That's why there are the six containment relations.

|
Each node of a Process Diagram symbolizes either an action or a control state. The diagram describes the causal relationship
between the actions. For this, the diagram is interpreted as a Petri net, where the actions are to be considered as transitions
and the control states as places. In contrast to operational states, control states are fundamentally elementary,
i.e. they have no internal structure.
Each node of a Composition Diagram symbolizes either an agent or a field of action. A field of action is either a location where material (information, matter, or energy) is stored, or a channel through which material is flowing. The diagram shows which agents have access to which fields of action. The agents need access to certain fields of action in order to change the state of the material occurring on those action fields. The current state of the material on an action field is a so-called operational state. The operational states which are possible on an action field are bound to a type that can be elementary or structured. A Data Structure Diagram describes a structured data type by showing which types of components it is composed of and via which relations these components are connected to each other. The diagram is a so-called entity relationship diagram (ERD)in which the component types correspond to the entities and the relations to the relationships. Any relation can also be considered as an entity which itself can be related to other entities. |